Preparing your lesson…正在准备你的课程…正在準備你的課程…Preparando tu lección…Préparation de votre leçon…Deine Lektion wird vorbereitet…Sto preparando la tua lezione…Preparando sua aula…レッスンを準備しています…수업을 준비하고 있어요…Menyediakan pelajaran anda…Menyiapkan pelajaranmu…
3.1 Defining the Derivative | ahaboard
Preparing your lesson…正在准备你的课程…正在準備你的課程…Preparando tu lección…Préparation de votre leçon…Deine Lektion wird vorbereitet…Sto preparando la tua lezione…Preparando sua aula…レッスンを準備しています…수업을 준비하고 있어요…Menyediakan pelajaran anda…Menyiapkan pelajaranmu…
Now that we have both a conceptual understanding of a limit and the practical ability to compute limits, we have established the foundation for our study of calculus, the branch of mathematics in which we compute derivatives and integrals. Most mathematicians and historians agree that calculus was developed independently by the Englishman Isaac Newton (1643-1727) and the German Gottfried Leibniz (1646-1716), whose images appear in Figure 3.2. When we credit Newton and Leibniz with developing calculus, we are really referring to the fact that Newton and Leibniz were the first to understand the relationship between the derivative and the integral. Both mathematicians benefited from the work of predecessors, such as Barrow, Fermat, and Cavalieri. The initial relationship between the two mathematicians appears to have been amicable; however, in later years a bitter controversy erupted over whose work took precedence. Although it seems likely that Newton did, indeed, arrive at the ideas behind calculus first, we are indebted to Leibniz for the notation that we commonly use today.
Figure 3.2Newton and Leibniz are credited with developing calculus independently.
Tangent Lines
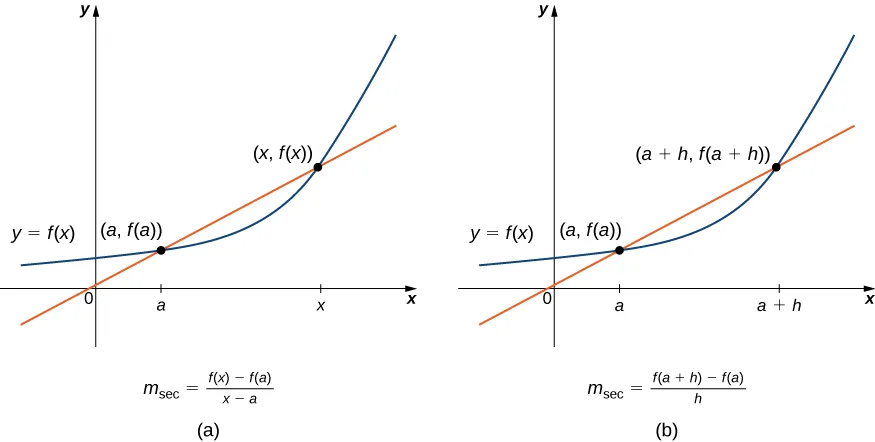
We begin our study of calculus by revisiting the notion of secant lines and tangent lines. Recall that we used the slope of a secant line to a function at a point (a,f(a)) to estimate the rate of change, or the rate at which one variable changes in relation to another variable. We can obtain the slope of the secant by choosing a value of x near a and drawing a line through the points (a,f(a)) and (x,f(x)), as shown in Figure 3.3. The slope of this line is given by an equation in the form of a difference quotient:
msec=x−af(x)−f(a).
We can also calculate the slope of a secant line to a function at a value a by using this equation and replacing x with a+h, where h is a value close to 0. We can then calculate the slope of the line through the points (a,f(a)) and (a+h,f(a+h)). In this case, we find the secant line has a slope given by the following difference quotient with increment h:
msec=a+h−af(a+h)−f(a)=hf(a+h)−f(a).
These two expressions for calculating the slope of a secant line are illustrated in Figure 3.3. We will see that each of these two methods for finding the slope of a secant line is of value. Depending on the setting, we can choose one or the other. The primary consideration in our choice usually depends on ease of calculation.
Figure 3.3We can calculate the slope of a secant line in either of two ways.
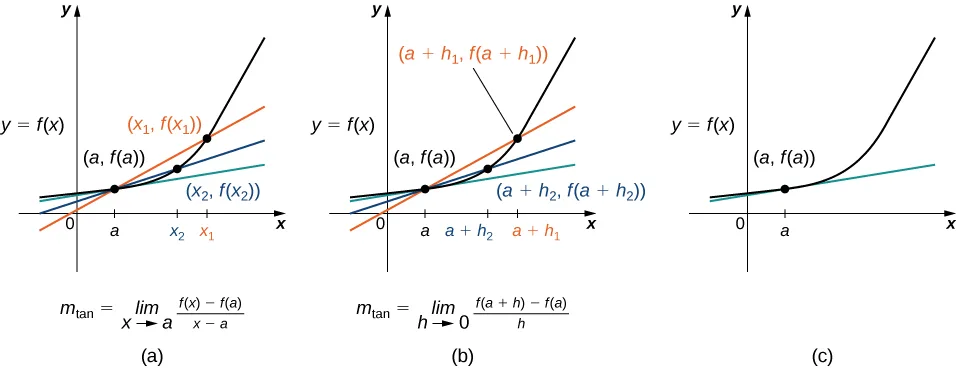
In Figure 3.4(a) we see that, as the values of x approach a, the slopes of the secant lines provide better estimates of the rate of change of the function at a. Furthermore, the secant lines themselves approach the tangent line to the function at a, which represents the limit of the secant lines. Similarly, Figure 3.4(b) shows that as the values of h get closer to 0, the secant lines also approach the tangent line. The slope of the tangent line at a is the rate of change of the function at a, as shown in Figure 3.4(c).
Figure 3.4The secant lines approach the tangent line (shown in green) as the second point approaches the first.
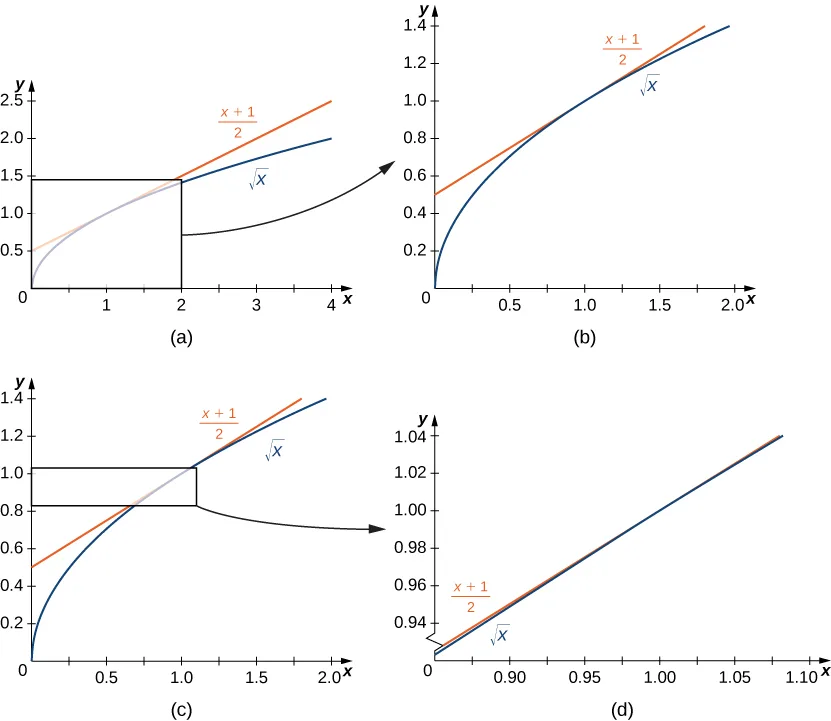
In Figure 3.5 we show the graph of f(x)=x and its tangent line at (1,1) in a series of tighter intervals about x=1. As the intervals become narrower, the graph of the function and its tangent line appear to coincide, making the values on the tangent line a good approximation to the values of the function for choices of x close to 1. In fact, the graph of f(x) itself appears to be locally linear in the immediate vicinity of x=1.
Figure 3.5For values of x close to 1, the graph of f(x)=x and its tangent line appear to coincide.
Formally we may define the tangent line to the graph of a function as follows.
Just as we have used two different expressions to define the slope of a secant line, we use two different forms to define the slope of the tangent line. In this text we use both forms of the definition. As before, the choice of definition will depend on the setting. Now that we have formally defined a tangent line to a function at a point, we can use this definition to find equations of tangent lines.
The Derivative of a Function at a Point
The type of limit we compute in order to find the slope of the line tangent to a function at a point occurs in many applications across many disciplines. These applications include velocity and acceleration in physics, marginal profit functions in business, and growth rates in biology. This limit occurs so frequently that we give this value a special name: the derivative. The process of finding a derivative is called differentiation.
Velocities and Rates of Change
Now that we can evaluate a derivative, we can use it in velocity applications. Recall that if s(t) is the position of an object moving along a coordinate axis, the average velocity of the object over a time interval [a,t] if t>a or [t,a] if t<a is given by the difference quotient
vave=t−as(t)−s(a).
As the values of t approach a, the values of vave approach the value we call the instantaneous velocity at a. That is, instantaneous velocity at a, denoted v(a), is given by
v(a)=s′(a)=t→alimt−as(t)−s(a).
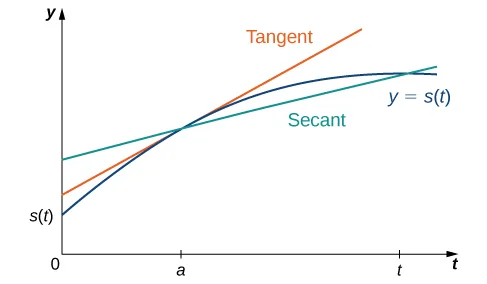
To better understand the relationship between average velocity and instantaneous velocity, see Figure 3.8. In this figure, the slope of the tangent line (shown in red) is the instantaneous velocity of the object at time t=a whose position at time t is given by the function s(t). The slope of the secant line (shown in green) is the average velocity of the object over the time interval [a,t].
Figure 3.8The slope of the secant line is the average velocity over the interval [a,t]. The slope of the tangent line is the instantaneous velocity.
We can use Defining the Derivative to calculate the instantaneous velocity, or we can estimate the velocity of a moving object by using a table of values. We can then confirm the estimate by using Defining the Derivative.
As we have seen throughout this section, the slope of a tangent line to a function and instantaneous velocity are related concepts. Each is calculated by computing a derivative and each measures the instantaneous rate of change of a function, or the rate of change of a function at any point along the function.
Key Concepts
The slope of the tangent line to a curve measures the instantaneous rate of change of a curve. We can calculate it by finding the limit of the difference quotient or the difference quotient with increment h.
The derivative of a function f(x) at a value a is found using either of the definitions for the slope of the tangent line.
Velocity is the rate of change of position. As such, the velocity v(t) at time t is the derivative of the position s(t) at time t. Average velocity is given by vave=t−as(t)−s(a). Instantaneous velocity is given by v(a)=s′(a)=t→alimt−as(t)−s(a).
We may estimate a derivative by using a table of values.