The rate laws discussed thus far relate the rate and the concentrations of reactants. We can also determine a second form of each rate law that relates the concentrations of reactants and time. These are called integrated rate laws. We can use an integrated rate law to determine the amount of reactant or product present after a period of time or to estimate the time required for a reaction to proceed to a certain extent. For example, an integrated rate law is used to determine the length of time a radioactive material must be stored for its radioactivity to decay to a safe level.
Using calculus, the differential rate law for a chemical reaction can be integrated with respect to time to give an equation that relates the amount of reactant or product present in a reaction mixture to the elapsed time of the reaction. This process can either be very straightforward or very complex, depending on the complexity of the differential rate law. For purposes of discussion, we will focus on the resulting integrated rate laws for first-, second-, and zero-order reactions.
First-Order Reactions
Integration of the rate law for a simple first-order reaction (rate = k[A]) results in an equation describing how the reactant concentration varies with time:
where [A]t is the concentration of A at any time t, [A]₀ is the initial concentration of A, and k is the first-order rate constant.
For mathematical convenience, this equation may be rearranged to other formats, including direct and indirect proportionalities:
and a format showing a linear dependence of concentration in time:
In the next example exercise, a linear format for the integrated rate law will be convenient:
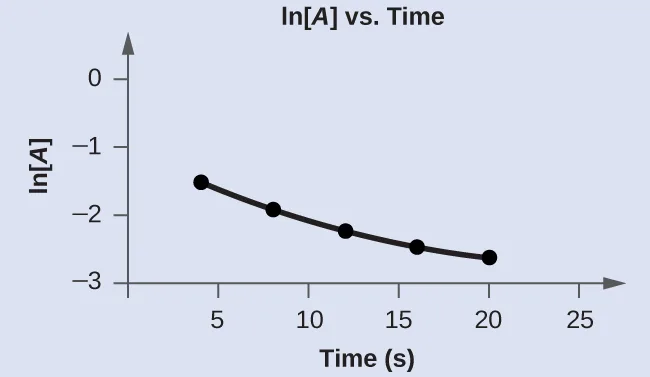
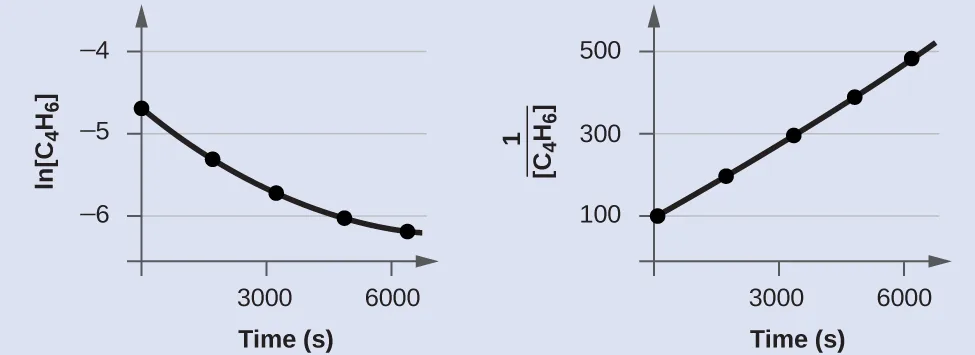
A plot of ln[A] versus t for a first-order reaction is a straight line with a slope of −k and a y-intercept of ln[A]₀. If a set of rate data are plotted in this fashion but do not result in a straight line, the reaction is not first order in A.
Second-Order Reactions
The equations that relate the concentrations of reactants and the rate constant of second-order reactions can be fairly complicated. To illustrate the point with minimal complexity, only the simplest second-order reactions will be described here, namely, those whose rates depend on the concentration of just one reactant. For these types of reactions, the differential rate law is written as:
For these second-order reactions, the integrated rate law is:
where the terms in the equation have their usual meanings as defined earlier.
The integrated rate law for second-order reactions has the form of the equation of a straight line:
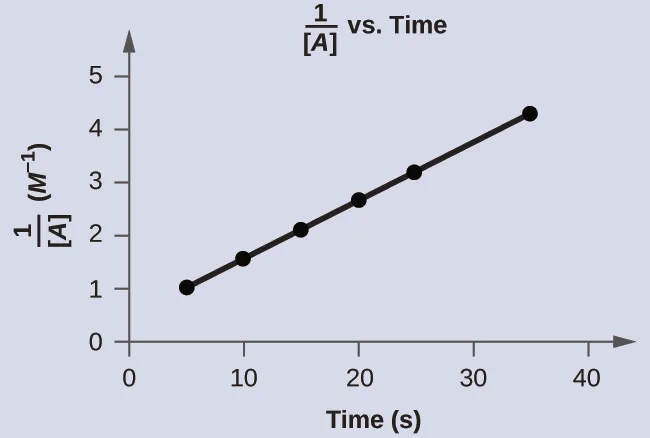
A plot of versus t for a second-order reaction is a straight line with a slope of k and a y-intercept of If the plot is not a straight line, then the reaction is not second order.
Zero-Order Reactions
For zero-order reactions, the differential rate law is:
A zero-order reaction thus exhibits a constant reaction rate, regardless of the concentration of its reactant(s). This may seem counterintuitive, since the reaction rate certainly can’t be finite when the reactant concentration is zero. For purposes of this introductory text, it will suffice to note that zero-order kinetics are observed for some reactions only under certain specific conditions. These same reactions exhibit different kinetic behaviors when the specific conditions aren’t met, and for this reason the more prudent term pseudo-zero-order is sometimes used.
The integrated rate law for a zero-order reaction is a linear function:
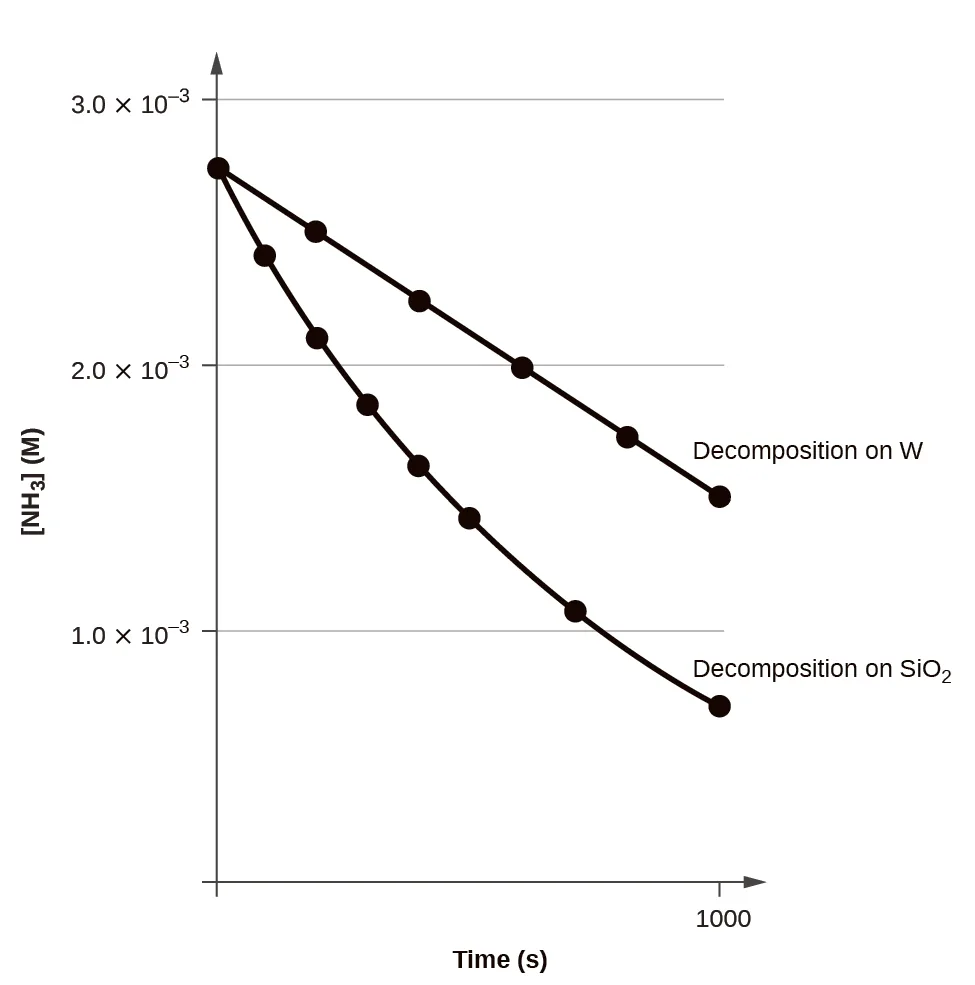
A plot of [A] versus t for a zero-order reaction is a straight line with a slope of −k and a y-intercept of [A]₀. Figure 12.11 shows a plot of [NH₃] versus t for the thermal decomposition of ammonia at the surface of two different heated solids. The decomposition reaction exhibits first-order behavior at a quartz (SiO₂) surface, as suggested by the exponentially decaying plot of concentration versus time. On a tungsten surface, however, the plot is linear, indicating zero-order kinetics.
The Half-Life of a Reaction
The half-life of a reaction (t1/2) is the time required for one-half of a given amount of reactant to be consumed. In each succeeding half-life, half of the remaining concentration of the reactant is consumed. Using the decomposition of hydrogen peroxide (Figure 12.2) as an example, we find that during the first half-life (from 0.00 hours to 6.00 hours), the concentration of H₂O₂ decreases from 1.000 M to 0.500 M. During the second half-life (from 6.00 hours to 12.00 hours), it decreases from 0.500 M to 0.250 M; during the third half-life, it decreases from 0.250 M to 0.125 M. The concentration of H₂O₂ decreases by half during each successive period of 6.00 hours. The decomposition of hydrogen peroxide is a first-order reaction, and, as can be shown, the half-life of a first-order reaction is independent of the concentration of the reactant. However, half-lives of reactions with other orders depend on the concentrations of the reactants.
First-Order Reactions
An equation relating the half-life of a first-order reaction to its rate constant may be derived from the integrated rate law as follows:
Invoking the definition of half-life, symbolized requires that the concentration of A at this point is one-half its initial concentration:
Substituting these terms into the rearranged integrated rate law and simplifying yields the equation for half-life:
This equation describes an expected inverse relation between the half-life of the reaction and its rate constant, k. Faster reactions exhibit larger rate constants and correspondingly shorter half-lives. Slower reactions exhibit smaller rate constants and longer half-lives.
Second-Order Reactions
Following the same approach as used for first-order reactions, an equation relating the half-life of a second-order reaction to its rate constant and initial concentration may be derived from its integrated rate law:
or
Restrict t to t1/2
define [A] as one-half [A]₀
and then substitute into the integrated rate law and simplify:
For a second-order reaction, is inversely proportional to the concentration of the reactant, and the half-life increases as the reaction proceeds because the concentration of reactant decreases. Unlike with first-order reactions, the rate constant of a second-order reaction cannot be calculated directly from the half-life unless the initial concentration is known.
Zero-Order Reactions
As for other reaction orders, an equation for zero-order half-life may be derived from the integrated rate law:
Restricting the time and concentrations to those defined by half-life: and Substituting these terms into the zero-order integrated rate law yields:
As for all reaction orders, the half-life for a zero-order reaction is inversely proportional to its rate constant. However, the half-life of a zero-order reaction increases as the initial concentration increases.
Equations for both differential and integrated rate laws and the corresponding half-lives for zero-, first-, and second-order reactions are summarized in Table 12.2.
| Summary of Rate Laws for Zero-, First-, and Second-Order Reactions | |||
| Zero-Order | First-Order | Second-Order | |
| rate law | rate = k | rate = k[A] | rate = k[A]² |
| units of rate constant | M s⁻¹ | s⁻¹ | M⁻¹ s⁻¹ |
| integrated rate law |
Key Concepts and Summary
Integrated rate laws are mathematically derived from differential rate laws, and they describe the time dependence of reactant and product concentrations.
The half-life of a reaction is the time required to decrease the amount of a given reactant by one-half. A reaction’s half-life varies with rate constant and, for some reaction orders, reactant concentration. The half-life of a zero-order reaction decreases as the initial concentration of the reactant in the reaction decreases. The half-life of a first-order reaction is independent of concentration, and the half-life of a second-order reaction decreases as the concentration increases.
Key Equations
| integrated rate law for zero-order reactions: |
| half-life for a zero-order reaction |