State whether the given sums are equal or unequal.
- and
- and
Preparing your lesson…正在准备你的课程…正在準備你的課程…Preparando tu lección…Préparation de votre leçon…Deine Lektion wird vorbereitet…Sto preparando la tua lezione…Preparando sua aula…レッスンを準備しています…수업을 준비하고 있어요…Menyediakan pelajaran anda…Menyiapkan pelajaranmu…
Preparing your lesson…正在准备你的课程…正在準備你的課程…Preparando tu lección…Préparation de votre leçon…Deine Lektion wird vorbereitet…Sto preparando la tua lezione…Preparando sua aula…レッスンを準備しています…수업을 준비하고 있어요…Menyediakan pelajaran anda…Menyiapkan pelajaranmu…
Calculus Volume 1 · 5.1 Approximating Areas
32 problems from the book, with its answers. Check your working, or have any of them explained to you on the whiteboard.
Exercises 1
State whether the given sums are equal or unequal.
Exercises 3
In the following exercises, use the rules for sums of powers of integers to compute the sums.
Exercises 5
Suppose that and In the following exercises, compute the sums.
Exercises 7
Suppose that and In the following exercises, compute the sums.
Exercises 8
In the following exercises, use summation properties and formulas to rewrite and evaluate the sums.
Exercises 9
In the following exercises, use summation properties and formulas to rewrite and evaluate the sums.
Exercises 11
In the following exercises, use summation properties and formulas to rewrite and evaluate the sums.
Exercises 13
Let denote the left-endpoint sum using n subintervals and let denote the corresponding right-endpoint sum. In the following exercises, compute the indicated left and right sums for the given functions on the indicated interval.
R₄ for on
Exercises 15
Let denote the left-endpoint sum using n subintervals and let denote the corresponding right-endpoint sum. In the following exercises, compute the indicated left and right sums for the given functions on the indicated interval.
R₆ for on
Exercises 17
Let denote the left-endpoint sum using n subintervals and let denote the corresponding right-endpoint sum. In the following exercises, compute the indicated left and right sums for the given functions on the indicated interval.
L₄ for on
Exercises 18
Let denote the left-endpoint sum using n subintervals and let denote the corresponding right-endpoint sum. In the following exercises, compute the indicated left and right sums for the given functions on the indicated interval.
R₈ for on
Exercises 19
Let denote the left-endpoint sum using n subintervals and let denote the corresponding right-endpoint sum. In the following exercises, compute the indicated left and right sums for the given functions on the indicated interval.
L₈ for on
Exercises 21
Let denote the left-endpoint sum using n subintervals and let denote the corresponding right-endpoint sum. In the following exercises, compute the indicated left and right sums for the given functions on the indicated interval.
Compute the left and right Riemann sums—L₆ and R₆, respectively—for on Compute their average value and compare it with the area under the graph of .
Exercises 23
Let denote the left-endpoint sum using n subintervals and let denote the corresponding right-endpoint sum. In the following exercises, compute the indicated left and right sums for the given functions on the indicated interval.
Compute the left and right Riemann sums—L₆ and R₆, respectively—for on and compare their values.
Exercises 25
Express the following endpoint sums in sigma notation but do not evaluate them.
L₁₀ for on
Exercises 27
Express the following endpoint sums in sigma notation but do not evaluate them.
R₁₀₀ for on
Exercises 29
In the following exercises, graph the function then use a calculator or a computer program to evaluate the following left and right endpoint sums. If the two agree, say "neither."
[T] L₁₀₀ and R₁₀₀ for on the interval
Exercises 31
In the following exercises, graph the function then use a calculator or a computer program to evaluate the following left and right endpoint sums. If the two agree, say "neither."
[T] L₁₀₀ and R₁₀₀ for on the interval
Exercises 33
In the following exercises, graph the function then use a calculator or a computer program to evaluate the following left and right endpoint sums. If the two agree, say "neither."
[T] L₁₀₀ and R₁₀₀ for on the interval
Exercises 35
In the following exercises, graph the function then use a calculator or a computer program to evaluate the following left and right endpoint sums. If the two agree, say "neither."
Let denote the total rainfall in Portland on the jth day of the year in 2009. Interpret
Exercises 37
In the following exercises, graph the function then use a calculator or a computer program to evaluate the following left and right endpoint sums. If the two agree, say "neither."
To help get in shape, Joe gets a new pair of running shoes. If Joe runs 1 mi each day in week 1 and adds mi to his daily routine each week, what is the total mileage on Joe’s shoes after 25 weeks?
Exercises 39
In the following exercises, graph the function then use a calculator or a computer program to evaluate the following left and right endpoint sums. If the two agree, say "neither."
The following table gives the approximate increase in sea level in inches over 20 years starting in the given year. Estimate the net change in mean sea level from 1870 to 2010.
| Starting Year | 20-Year Change |
| 1870 | 0.3 |
| 1890 | 1.5 |
| 1910 | 0.2 |
| 1930 | 2.8 |
| 1950 | 0.7 |
| 1970 | 1.1 |
| 1990 | 1.5 |
Exercises 41
In the following exercises, graph the function then use a calculator or a computer program to evaluate the following left and right endpoint sums. If the two agree, say "neither."
The following table gives the percent growth of the U.S. population beginning in July of the year indicated. If the U.S. population was 281,421,906 in July 2000, estimate the U.S. population in July 2010.
| Year | % Change/Year |
| 2000 | 1.12 |
| 2001 | 0.99 |
| 2002 | 0.93 |
| 2003 | 0.86 |
| 2004 | 0.93 |
| 2005 | 0.93 |
| 2006 | 0.97 |
| 2007 | 0.96 |
| 2008 | 0.95 |
| 2009 | 0.88 |
(Hint: To obtain the population in July 2001, multiply the population in July 2000 by 1.0112 to get 284,573,831.)
Exercises 43
In the following exercises, estimate the areas under the curves by computing the left Riemann sums, L₈.
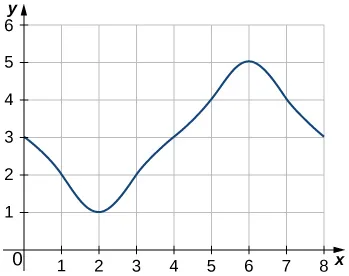
Exercises 45
In the following exercises, estimate the areas under the curves by computing the left Riemann sums, L₈.
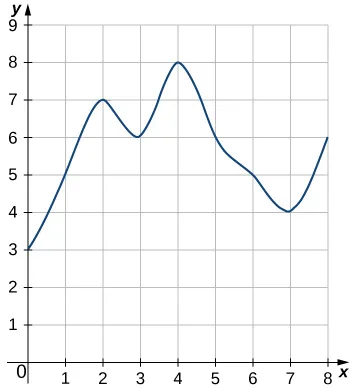
Exercises 47
In the following exercises, estimate the areas under the curves by computing the left Riemann sums, L₈.
[T] Use a computer algebra system to compute the Riemann sum, L, for for on
Exercises 49
In the following exercises, use a calculator or a computer program to evaluate the endpoint sums R and L for How do these estimates compare with the exact answers, which you can find via geometry?
[T] on the interval
Exercises 51
In the following exercises, use a calculator or a computer program to evaluate the endpoint sums R and L for
[T] on the interval which has an exact area of
Exercises 53
In the following exercises, use a calculator or a computer program to evaluate the endpoint sums R and L for
Explain why, if and is increasing on that the left endpoint estimate is a lower bound for the area below the graph of on
Exercises 55
In the following exercises, use a calculator or a computer program to evaluate the endpoint sums R and L for
Show that, in general,
Exercises 57
In the following exercises, use a calculator or a computer program to evaluate the endpoint sums R and L for
For each of the three graphs:
Exercises 59
In the following exercises, use a calculator or a computer program to evaluate the endpoint sums R and L for
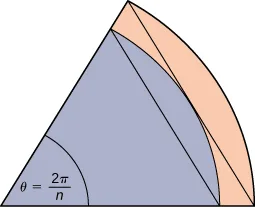
A unit circle is made up of n wedges equivalent to the inner wedge in the figure. The base of the inner triangle is 1 unit and its height is
The base of the outer triangle is
The tutor teaches the whole section, drawing it out step by step and answering your questions as you go.
and the height is Use this information to argue that the area of a unit circle is equal to π.