We have studied the general characteristics of functions, so now let’s examine some specific classes of functions. We begin by reviewing the basic properties of linear and quadratic functions, and then generalize to include higher-degree polynomials. By combining root functions with polynomials, we can define general algebraic functions and distinguish them from the transcendental functions we examine later in this chapter. We finish the section with examples of piecewise-defined functions and take a look at how to sketch the graph of a function that has been shifted, stretched, or reflected from its initial form.
Linear Functions and Slope
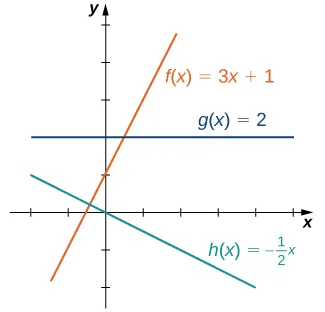
The easiest type of function to consider is a linear function. Linear functions have the form where and are constants. In Figure 1.15, we see examples of linear functions when is positive, negative, and zero. Note that if the graph of the line rises as increases. In other words, is increasing on If the graph of the line falls as increases. In this case, is decreasing on If the line is horizontal.
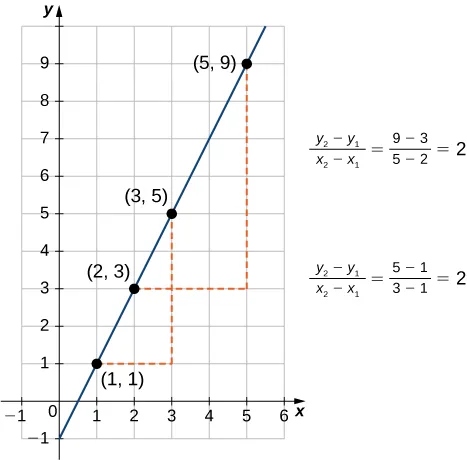
As suggested by Figure 1.15, the graph of any linear function is a line. One of the distinguishing features of a line is its slope. The slope is the change in for each unit change in The slope measures both the steepness and the direction of a line. If the slope is positive, the line points upward when moving from left to right. If the slope is negative, the line points downward when moving from left to right. If the slope is zero, the line is horizontal. To calculate the slope of a line, we need to determine the ratio of the change in versus the change in To do so, we choose any two points and on the line and calculate In Figure 1.16, we see this ratio is independent of the points chosen.
We now examine the relationship between slope and the formula for a linear function. Consider the linear function given by the formula As discussed earlier, we know the graph of a linear function is given by a line. We can use our definition of slope to calculate the slope of this line. As shown, we can determine the slope by calculating for any points and on the line. Evaluating the function at we see that is a point on this line. Evaluating this function at we see that is also a point on this line. Therefore, the slope of this line is
We have shown that the coefficient is the slope of the line. We can conclude that the formula describes a line with slope Furthermore, because this line intersects the -axis at the point we see that the -intercept for this linear function is We conclude that the formula tells us the slope, and the -intercept, for this line. Since we often use the symbol to denote the slope of a line, we can write
to denote the slope-intercept form of a linear function.
Sometimes it is convenient to express a linear function in different ways. For example, suppose the graph of a linear function passes through the point and the slope of the line is Since any other point on the graph of must satisfy the equation
this linear function can be expressed by writing
We call this equation the point-slope equation for that linear function.
Since every nonvertical line is the graph of a linear function, the points on a nonvertical line can be described using the slope-intercept or point-slope equations. However, a vertical line does not represent the graph of a function and cannot be expressed in either of these forms. Instead, a vertical line is described by the equation for some constant Since neither the slope-intercept form nor the point-slope form allows for vertical lines, we use the notation
where are both not zero, to denote the standard form of a line.
Polynomials
A linear function is a special type of a more general class of functions: polynomials. A polynomial function is any function that can be written in the form
for some integer and constants where In the case when we allow for if the function is called the . The value is called the of the polynomial; the constant is called the . A linear function of the form is a polynomial of degree 1 if and degree 0 if A polynomial of degree 0 is also called a . A polynomial function of degree 2 is called a . In particular, a quadratic function has the form where A polynomial function of degree is called a .
Power Functions
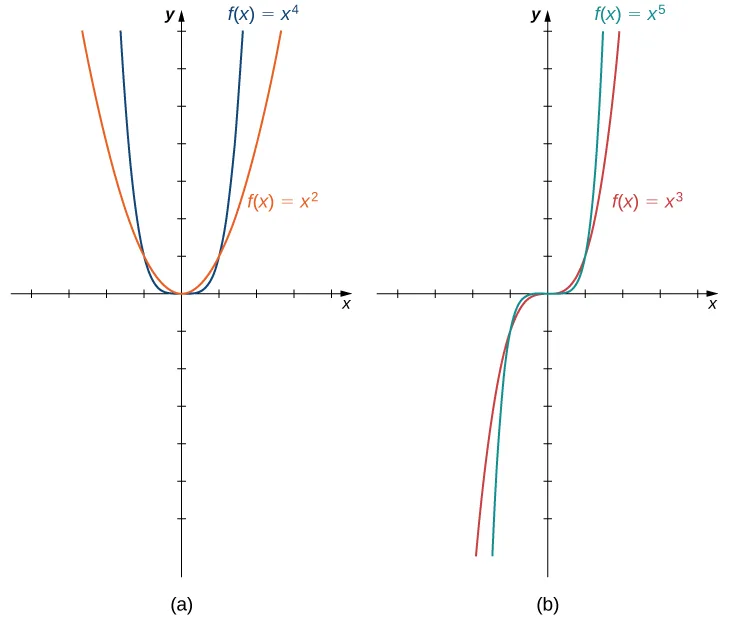
Some polynomial functions are power functions. A power function is any function of the form where and are any real numbers. The exponent in a power function can be any real number, but here we consider the case when the exponent is a positive integer. (We consider other cases later.) If the exponent is a positive integer, then is a polynomial. If is even, then is an even function because if is even. If is odd, then is an odd function because if is odd (Figure 1.18).
Behavior at Infinity
To determine the behavior of a function as the inputs approach infinity, we look at the values as the inputs, become larger. For some functions, the values of approach a finite number. For example, for the function the values become closer and closer to zero for all values of as they get larger and larger. For this function, we say approaches two as goes to infinity,” and we write as The line is a horizontal asymptote for the function because the graph of the function gets closer to the line as gets larger.
For other functions, the values may not approach a finite number but instead may become larger for all values of as they get larger. In that case, we say approaches infinity as approaches infinity,” and we write as For example, for the function the outputs become larger as the inputs get larger. We can conclude that the function approaches infinity as approaches infinity, and we write as The behavior as and the meaning of as or can be defined similarly. We can describe what happens to the values of as and as as the of the function.
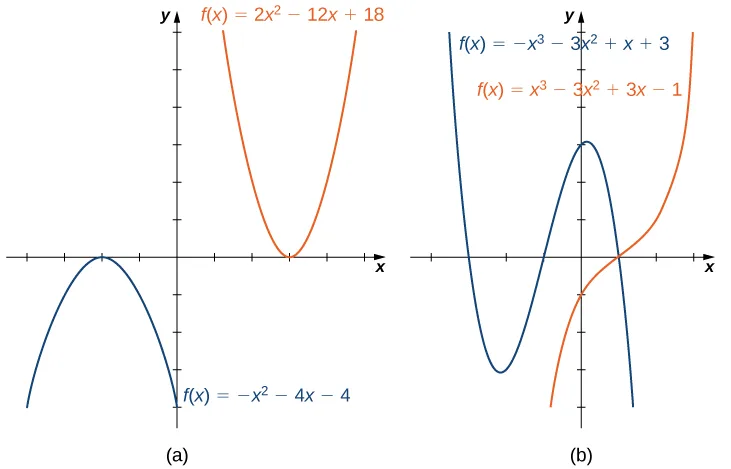
To understand the end behavior for polynomial functions, we can focus on quadratic and cubic functions. The behavior for higher-degree polynomials can be analyzed similarly. Consider a quadratic function If the values as If the values as Since the graph of a quadratic function is a parabola, the parabola opens upward if the parabola opens downward if (See Figure 1.19(a).)
Now consider a cubic function If then as and as If then as and as As we can see from both of these graphs, the leading term of the polynomial determines the end behavior. (See Figure 1.19(b).)
Zeros of Polynomial Functions
Another characteristic of the graph of a polynomial function is where it intersects the -axis. To determine where a function intersects the -axis, we need to solve the equation for x. In the case of the linear function the -intercept is given by solving the equation In this case, we see that the -intercept is given by In the case of a quadratic function, finding the -intercept(s) requires finding the zeros of a quadratic equation: In some cases, it is easy to factor the polynomial to find the zeros. If not, we make use of the quadratic formula.
In the case of higher-degree polynomials, it may be more complicated to determine where the graph intersects the -axis. In some instances, it is possible to find the -intercepts by factoring the polynomial to find its zeros. In other cases, it is impossible to calculate the exact values of the -intercepts. However, as we see later in the text, in cases such as this, we can use analytical tools to approximate (to a very high degree) where the -intercepts are located. Here we focus on the graphs of polynomials for which we can calculate their zeros explicitly.
Mathematical Models
A large variety of real-world situations can be described using mathematical models. A mathematical model is a method of simulating real-life situations with mathematical equations. Physicists, engineers, economists, and other researchers develop models by combining observation with quantitative data to develop equations, functions, graphs, and other mathematical tools to describe the behavior of various systems accurately. Models are useful because they help predict future outcomes. Examples of mathematical models include the study of population dynamics, investigations of weather patterns, and predictions of product sales.
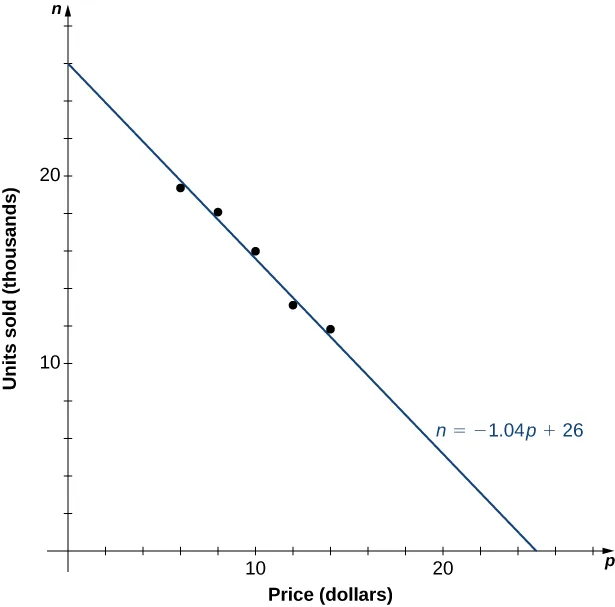
As an example, let’s consider a mathematical model that a company could use to describe its revenue for the sale of a particular item. The amount of revenue a company receives for the sale of items sold at a price of dollars per item is described by the equation The company is interested in how the sales change as the price of the item changes. Suppose the data in Table 1.6 show the number of units a company sells as a function of the price per item.
In Figure 1.20, we see the graph of the number of units sold (in thousands) as a function of price (in dollars). We note from the shape of the graph that the number of units sold is likely a linear function of price per item, and the data can be closely approximated by the linear function for where predicts the number of units sold in thousands. Using this linear function, the revenue (in thousands of dollars) can be estimated by the quadratic function
for In Example 1.15, we use this quadratic function to predict the amount of revenue the company receives depending on the price the company charges per item. Note that we cannot conclude definitively the actual number of units sold for values of for which no data are collected. However, given the other data values and the graph shown, it seems reasonable that the number of units sold (in thousands) if the price charged is dollars may be close to the values predicted by the linear function
Algebraic Functions
By allowing for quotients and fractional powers in polynomial functions, we create a larger class of functions. An algebraic function is one that involves addition, subtraction, multiplication, division, rational powers, and roots. Two types of algebraic functions are rational functions and root functions.
Just as rational numbers are quotients of integers, rational functions are quotients of polynomials. In particular, a rational function is any function of the form where and are polynomials. For example,
are rational functions. Notice that is a polynomial function. So, all polynomial functions, , can be considered rational functions because . A root function is a power function of the form where is a positive integer greater than one. For example, is the square-root function and is the cube-root function. By allowing for compositions of root functions and rational functions, we can create other algebraic functions. For example, is an algebraic function.
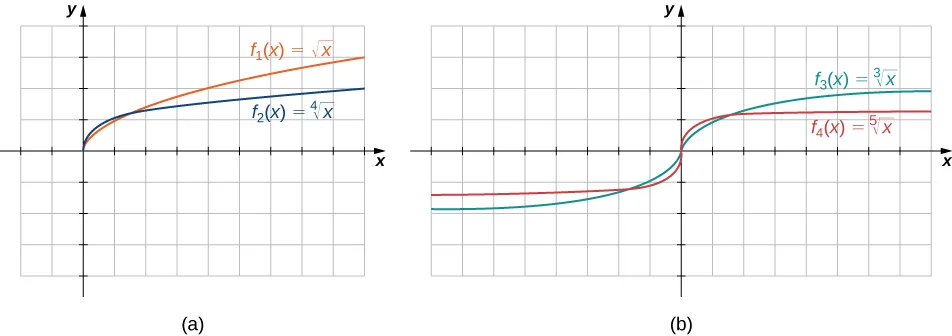
The root functions have defining characteristics depending on whether is odd or even. For all even integers the domain of is the interval For all odd integers the domain of is the set of all real numbers. Since for odd integers is an odd function if is odd. See the graphs of root functions for different values of in Figure 1.21.
Transcendental Functions
Thus far, we have discussed algebraic functions. Some functions, however, cannot be described by basic algebraic operations. These functions are known as transcendental functions because they are said to “transcend,” or go beyond, algebra. The most common transcendental functions are trigonometric, exponential, and logarithmic functions. A trigonometric function relates the ratios of two sides of a right triangle. They are (We discuss trigonometric functions later in the chapter.) An exponential function is a function of the form where the base A is a function of the form for some constant where if and only if (We also discuss exponential and logarithmic functions later in the chapter.)
Piecewise-Defined Functions
Sometimes a function is defined by different formulas on different parts of its domain. A function with this property is known as a piecewise-defined function. The absolute value function is an example of a piecewise-defined function because the formula changes with the sign of
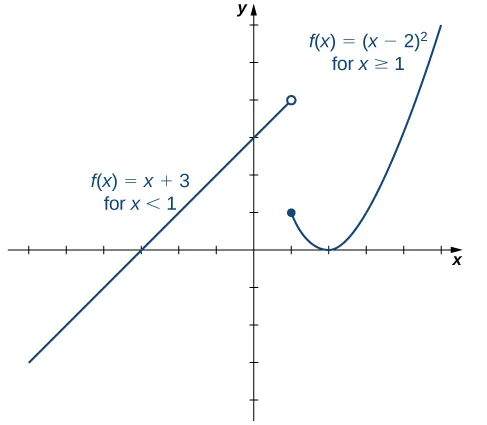
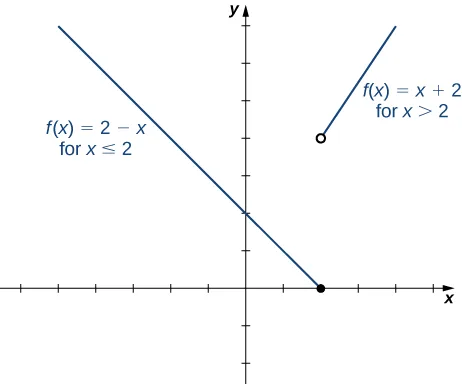
Other piecewise-defined functions may be represented by completely different formulas, depending on the part of the domain in which a point falls. To graph a piecewise-defined function, we graph each part of the function in its respective domain, on the same coordinate system. If the formula for a function is different for and we need to pay special attention to what happens at when we graph the function. Sometimes the graph needs to include an open or closed circle to indicate the value of the function at We examine this in the next example.
Transformations of Functions
We have seen several cases in which we have added, subtracted, or multiplied constants to form variations of simple functions. In the previous example, for instance, we subtracted 2 from the argument of the function to get the function This subtraction represents a shift of the function two units to the right. A shift, horizontally or vertically, is a type of . Other transformations include horizontal and vertical scalings, and reflections about the axes.
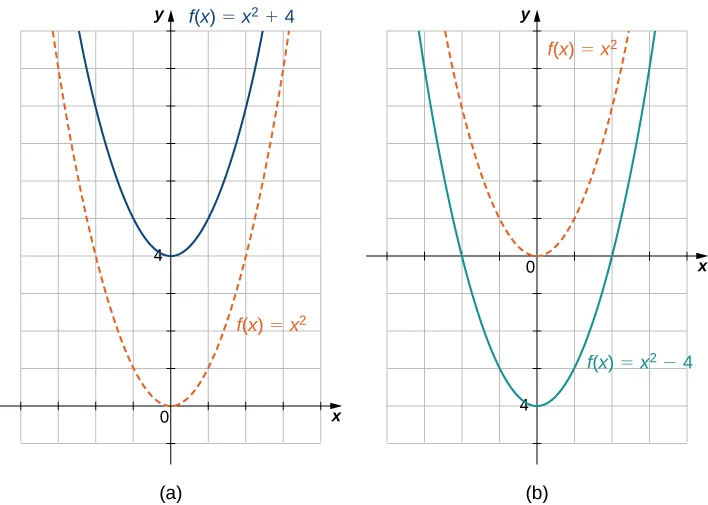
A vertical shift of a function occurs if we add or subtract the same constant to each output For the graph of is a shift of the graph of up units, whereas the graph of is a shift of the graph of down units. For example, the graph of the function is the graph of shifted up units; the graph of the function is the graph of shifted down units (Figure 1.23).
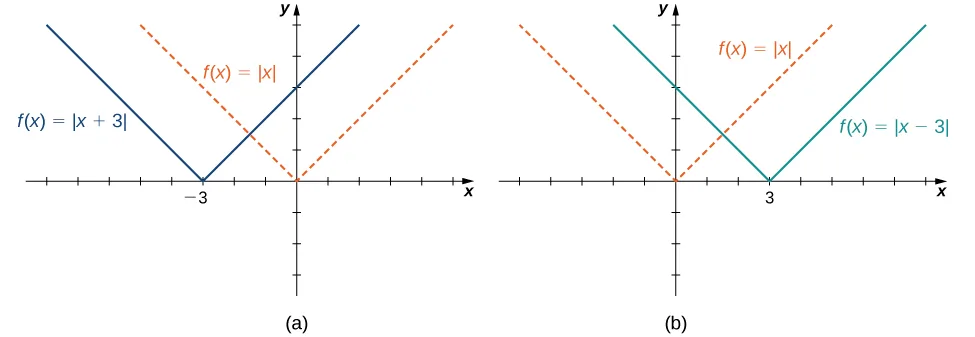
A horizontal shift of a function occurs if we add or subtract the same constant to each input For the graph of is a shift of the graph of to the left units; the graph of is a shift of the graph of to the right units. Why does the graph shift left when adding a constant and shift right when subtracting a constant? To answer this question, let’s look at an example.
Consider the function and evaluate this function at Since and the graph of is the graph of shifted left 3 units. Similarly, the graph of is the graph of shifted right units (Figure 1.24).
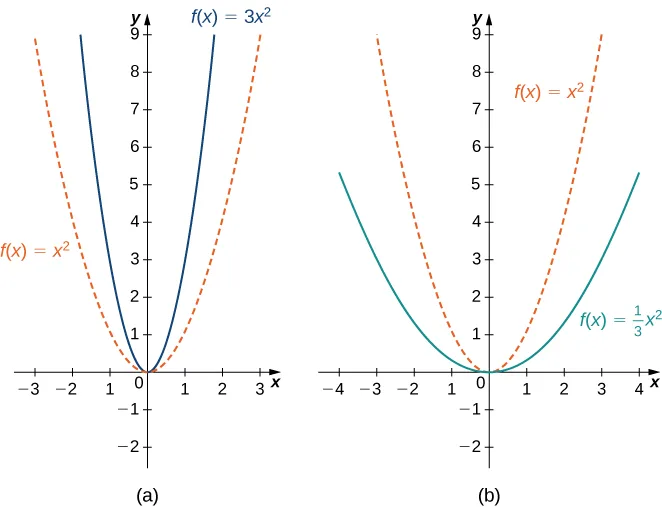
A vertical scaling of a graph occurs if we multiply all outputs of a function by the same positive constant. For the graph of the function is the graph of scaled vertically by a factor of If the values of the outputs for the function are larger than the values of the outputs for the function therefore, the graph has been stretched vertically. If then the outputs of the function are smaller, so the graph has been compressed. For example, the graph of the function is the graph of stretched vertically by a factor of 3, whereas the graph of is the graph of compressed vertically by a factor of (Figure 1.25).
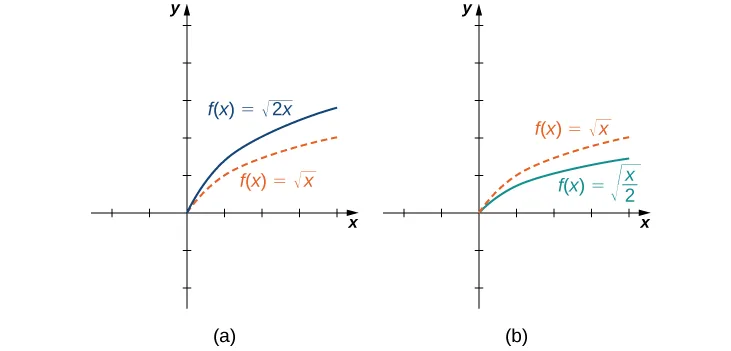
The horizontal scaling of a function occurs if we multiply the inputs by the same positive constant. For the graph of the function is the graph of scaled horizontally by a factor of If the graph of is the graph of compressed horizontally. If the graph of is the graph of stretched horizontally. For example, consider the function and evaluate at Since the graph of is the graph of compressed horizontally. The graph of is a horizontal stretch of the graph of (Figure 1.26).
We have explored what happens to the graph of a function when we multiply by a constant to get a new function We have also discussed what happens to the graph of a function when we multiply the independent variable by to get a new function However, we have not addressed what happens to the graph of the function if the constant is negative. If we have a constant we can write as a positive number multiplied by but, what kind of transformation do we get when we multiply the function or its argument by When we multiply all the outputs by we get a reflection about the -axis. When we multiply all inputs by we get a reflection about the -axis. For example, the graph of is the graph of reflected about the -axis. The graph of is the graph of reflected about the -axis (Figure 1.27).
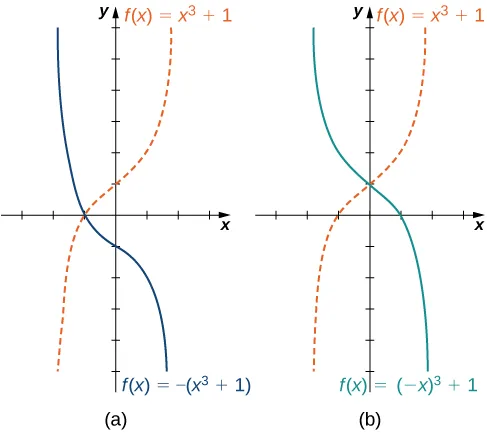
If the graph of a function consists of more than one transformation of another graph, it is important to transform the graph in the correct order. Given a function the graph of the related function can be obtained from the graph of by performing the transformations in the following order.
- Horizontal shift of the graph of If shift left. If shift right.
- Horizontal scaling of the graph of by a factor of If reflect the graph about the -axis.
We can summarize the different transformations and their related effects on the graph of a function in the following table.
| Transformation of | Effect on the graph of |
| Vertical shift up units | |
Key Concepts
- The power function is an even function if is even and and it is an odd function if is odd.
- The root function has the domain if is even and the domain if is odd. If is odd, then is an odd function.
Key Equations
| Point-slope equation of a line | |
| Slope-intercept form of a line |