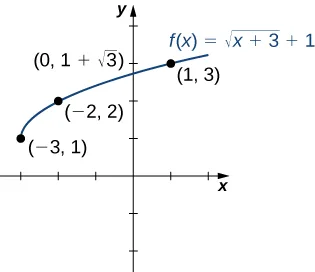
In this section, we provide a formal definition of a function and examine several ways in which functions are represented—namely, through tables, formulas, and graphs. We study formal notation and terms related to functions. We also define composition of functions and symmetry properties. Most of this material will be a review for you, but it serves as a handy reference to remind you of some of the algebraic techniques useful for working with functions.
Functions
Given two sets and a set with elements that are ordered pairs where is an element of and is an element of is a relation from to A relation from to defines a relationship between those two sets. A function is a special type of relation in which each element of the first set is related to exactly one element of the second set. The element of the first set is called the input; the element of the second set is called the output. Functions are used all the time in mathematics to describe relationships between two sets. For any function, when we know the input, the output is determined, so we say that the output is a function of the input. For example, the area of a square is determined by its side length, so we say that the area (the output) is a function of its side length (the input). The velocity of a ball thrown in the air can be described as a function of the amount of time the ball is in the air. The cost of mailing a package is a function of the weight of the package. Since functions have so many uses, it is important to have precise definitions and terminology to study them.
For example, consider the function where the domain is the set of all real numbers and the rule is to square the input. Then, the input is assigned to the output Since every nonnegative real number has a real-value square root, every nonnegative number is an element of the range of this function. Since there is no real number with a square that is negative, the negative real numbers are not elements of the range. We conclude that the range is the set of nonnegative real numbers.
For a general function with domain we often use to denote the input and to denote the output associated with When doing so, we refer to as the independent variable and as the dependent variable, because it depends on Using function notation, we write and we read this equation as equals of For the squaring function described earlier, we write
The concept of a function can be visualized using Figure 1.2, Figure 1.3, and Figure 1.4.
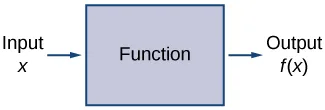
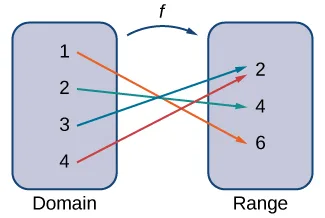
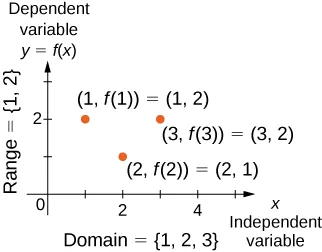
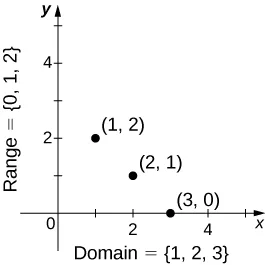
We can also visualize a function by plotting points in the coordinate plane where The graph of a function is the set of all these points. For example, consider the function where the domain is the set and the rule is In Figure 1.5, we plot a graph of this function.
Every function has a domain. However, sometimes a function is described by an equation, as in with no specific domain given. In this case, the domain is taken to be the set of all real numbers, , for which is a real number. For example, since any real number can be squared, if no other domain is specified, we consider the domain of to be the set of all real numbers. On the other hand, the square root function gives a real output only if is nonnegative. Therefore, the domain of the function is the set of nonnegative real numbers, sometimes called the .
For the functions and the domains are sets with an infinite number of elements. Clearly we cannot list all these elements. When describing a set with an infinite number of elements, it is often helpful to use set-builder or interval notation. When using set-builder notation to describe a subset of all real numbers, denoted we write
We read this as the set of real numbers such that has some property. For example, if we were interested in the set of real numbers that are greater than one but less than five, we could denote this set using set-builder notation by writing
A set such as this, which contains all numbers greater than and less than can also be denoted using the interval notation Therefore,
The numbers and are called the endpoints of this set. If we want to consider the set that includes the endpoints, we would denote this set by writing
We can use similar notation if we want to include one of the endpoints, but not the other. To denote the set of nonnegative real numbers, we would use the set-builder notation
The smallest number in this set is zero, but this set does not have a largest number. Using interval notation, we would use the symbol which refers to positive infinity, and we would write the set as
It is important to note that is not a real number. It is used symbolically here to indicate that this set includes all real numbers greater than or equal to zero. Similarly, if we wanted to describe the set of all nonpositive numbers, we could write
Here, the notation refers to negative infinity, and it indicates that we are including all numbers less than or equal to zero, no matter how small. The set
refers to the set of all real numbers.
Some functions are defined using different equations for different parts of their domain. These types of functions are known as piecewise-defined functions. For example, suppose we want to define a function with a domain that is the set of all real numbers such that for and for We denote this function by writing
When evaluating this function for an input the equation to use depends on whether or For example, since we use the fact that for and see that On the other hand, for we use the fact that for and see that
Representing Functions
Typically, a function is represented using one or more of the following tools:
- A table
- A graph
- A formula
We can identify a function in each form, but we can also use them together. For instance, we can plot on a graph the values from a table or create a table from a formula.
Tables
Functions described using a table of values arise frequently in real-world applications. Consider the following simple example. We can describe temperature on a given day as a function of time of day. Suppose we record the temperature every hour for a 24-hour period starting at midnight. We let our input variable be the time after midnight, measured in hours, and the output variable be the temperature hours after midnight, measured in degrees Fahrenheit. We record our data in Table 1.1.
| Hours after Midnight | Temperature | Hours after Midnight | Temperature |
| 0 | 58 | 12 | 84 |
| 1 | 54 | 13 | 85 |
| 2 | 53 | 14 | 85 |
| 3 | 52 | 15 | 83 |
| 4 |
We can see from the table that temperature is a function of time, and the temperature decreases, then increases, and then decreases again. However, we cannot get a clear picture of the behavior of the function without graphing it.
Graphs
Given a function described by a table, we can provide a visual picture of the function in the form of a graph. Graphing the temperatures listed in Table 1.1 can give us a better idea of their fluctuation throughout the day. Figure 1.6 shows the plot of the temperature function.
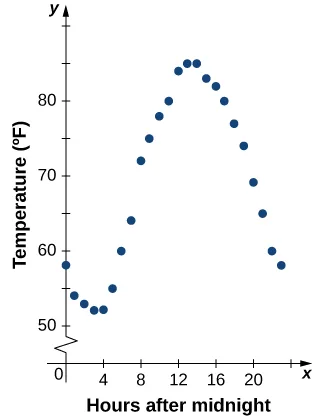
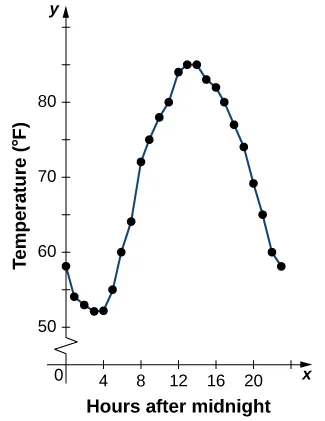
From the points plotted on the graph in Figure 1.6, we can visualize the general shape of the graph. It is often useful to connect the dots in the graph, which represent the data from the table. In this example, although we cannot make any definitive conclusion regarding what the temperature was at any time for which the temperature was not recorded, given the number of data points collected and the pattern in these points, it is reasonable to suspect that the temperatures at other times followed a similar pattern, as we can see in Figure 1.7.
Algebraic Formulas
Sometimes we are not given the values of a function in table form, rather we are given the values in an explicit formula. Formulas arise in many applications. For example, the area of a circle of radius is given by the formula When an object is thrown upward from the ground with an initial velocity ft/s, its height above the ground from the time it is thrown until it hits the ground is given by the formula When dollars are invested in an account at an annual interest rate compounded continuously, the amount of money after years is given by the formula Algebraic formulas are important tools to calculate function values. Often we also represent these functions visually in graph form.
Given an algebraic formula for a function the graph of is the set of points where is in the domain of and is in the range. To graph a function given by a formula, it is helpful to begin by using the formula to create a table of inputs and outputs. If the domain of consists of an infinite number of values, we cannot list all of them, but because listing some of the inputs and outputs can be very useful, it is often a good way to begin.
When creating a table of inputs and outputs, we typically check to determine whether zero is an output. Those values of where are called the zeros of a function. For example, the zeros of are The zeros determine where the graph of intersects the -axis, which gives us more information about the shape of the graph of the function. The graph of a function may never intersect the -axis, or it may intersect multiple (or even infinitely many) times.
Another point of interest is the -intercept, if it exists. The -intercept is given by
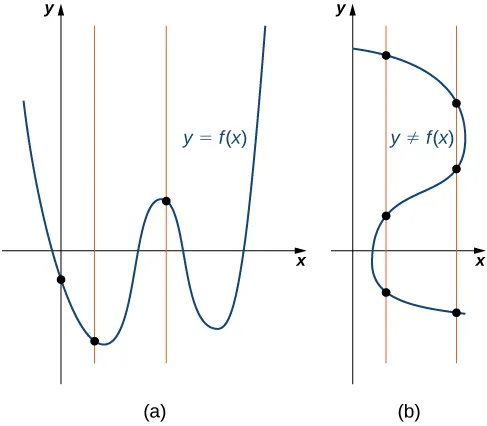
Since a function has exactly one output for each input, the graph of a function can have, at most, one -intercept. If is in the domain of a function then has exactly one -intercept. If is not in the domain of then has no -intercept. Similarly, for any real number if is in the domain of there is exactly one output and the line intersects the graph of exactly once. On the other hand, if is not in the domain of is not defined and the line does not intersect the graph of This property is summarized in the .
We can use this test to determine whether a set of plotted points represents the graph of a function (Figure 1.8).
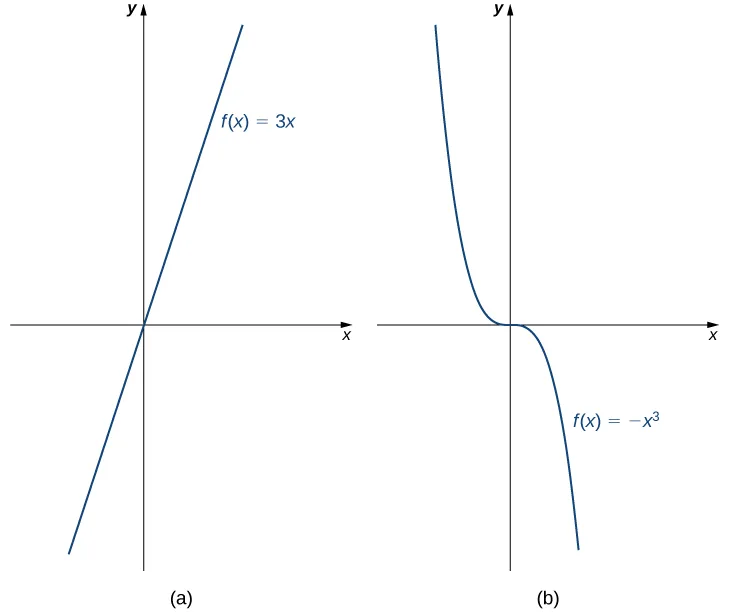
Note that for this function and the function graphed in Figure 1.9, the values of are getting smaller as is getting larger. A function with this property is said to be decreasing. On the other hand, for the function graphed in Figure 1.10, the values of are getting larger as the values of are getting larger. A function with this property is said to be increasing. It is important to note, however, that a function can be increasing on some interval or intervals and decreasing over a different interval or intervals. For example, using our temperature function in Figure 1.6, we can see that the function is decreasing on the interval increasing on the interval and then decreasing on the interval We make the idea of a function increasing or decreasing over a particular interval more precise in the next definition.
For example, the function is increasing on the interval because whenever On the other hand, the function is strictly decreasing on the interval because whenever (Figure 1.11).
Combining Functions
Now that we have reviewed the basic characteristics of functions, we can see what happens to these properties when we combine functions in different ways, using basic mathematical operations to create new functions. For example, if the cost for a company to manufacture items is described by the function and the revenue created by the sale of items is described by the function then the profit on the manufacture and sale of items is defined as Using the difference between two functions, we created a new function.
Alternatively, we can create a new function by composing two functions. For example, given the functions and the composite function is defined such that
The composite function is defined such that
Note that these two new functions are different from each other.
Combining Functions with Mathematical Operators
To combine functions using mathematical operators, we simply write the functions with the operator and simplify. Given two functions and we can define four new functions:
Function Composition
When we compose functions, we take a function of a function. For example, suppose the temperature on a given day is described as a function of time (measured in hours after midnight) as in Table 1.1. Suppose the cost to heat or cool a building for 1 hour, can be described as a function of the temperature Combining these two functions, we can describe the cost of heating or cooling a building as a function of time by evaluating We have defined a new function, denoted which is defined such that for all in the domain of This new function is called a composite function. We note that since cost is a function of temperature and temperature is a function of time, it makes sense to define this new function It does not make sense to consider because temperature is not a function of cost.
A composite function can be viewed in two steps. First, the function maps each input in the domain of to its output in the range of Second, since the range of is a subset of the domain of the output is an element in the domain of and therefore it is mapped to an output in the range of In Figure 1.12, we see a visual image of a composite function.
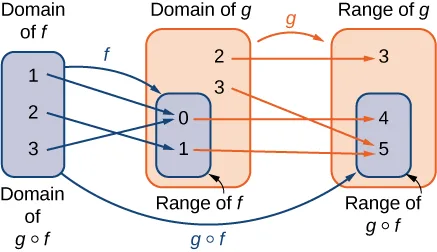
In Example 1.7, we can see that This tells us, in general terms, that the order in which we compose functions matters.
Symmetry of Functions
The graphs of certain functions have symmetry properties that help us understand the function and the shape of its graph. For example, consider the function shown in Figure 1.13(a). If we take the part of the curve that lies to the right of the y-axis and flip it over the y-axis, it lays exactly on top of the curve to the left of the y-axis. In this case, we say the function has symmetry about the y-axis. On the other hand, consider the function shown in Figure 1.13(b). If we take the graph and rotate it about the origin, the new graph will look exactly the same. In this case, we say the function has .
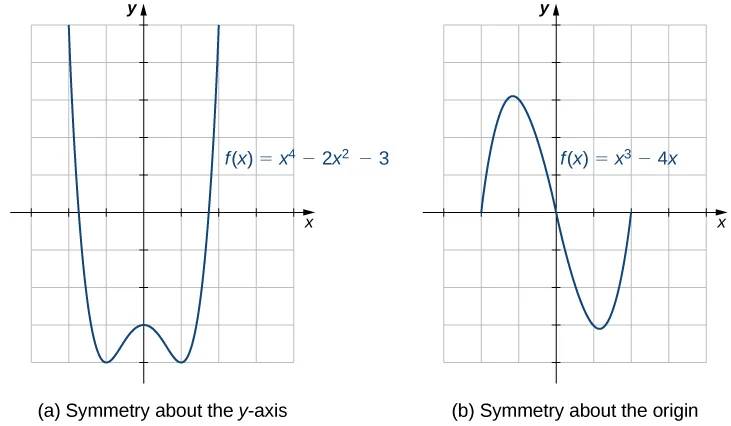
If we are given the graph of a function, it is easy to see whether the graph has one of these symmetry properties. But without a graph, how can we determine algebraically whether a function has symmetry? Looking at Figure 1.13 again, we see that since is symmetric about the -axis, if the point is on the graph, the point is on the graph. In other words, If a function has this property, we say is an even function, which has symmetry about the -axis. For example, is even because
In contrast, looking at Figure 1.13 again, if a function is symmetric about the origin, then whenever the point is on the graph, the point is also on the graph. In other words, If has this property, we say is an odd function, which has symmetry about the origin. For example, is odd because
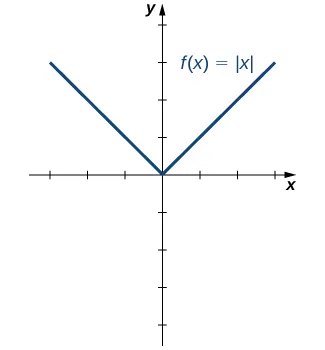
One symmetric function that arises frequently is the absolute value function, written as The absolute value function is defined as
Some students describe this function by stating that it “makes everything positive.” By the definition of the absolute value function, we see that if then and if then However, for Therefore, it is more accurate to say that for all nonzero inputs, the output is positive, but if the output We conclude that the range of the absolute value function is In Figure 1.14, we see that the absolute value function is symmetric about the -axis and is therefore an even function.
Key Concepts
- A function is a mapping from a set of inputs to a set of outputs with exactly one output for each input.
- If no domain is stated for a function the domain is considered to be the set of all real numbers for which the function is defined.
- When sketching the graph of a function each vertical line may intersect the graph, at most, once.
- A function may have any number of zeros, but it has, at most, one y-intercept.
- To define the composition the range of must be contained in the domain of
Key Equations
| Composition of two functions | |
| Absolute value function |