A rate is a measure of how some property varies with time. Speed is a familiar rate that expresses the distance traveled by an object in a given amount of time. Wage is a rate that represents the amount of money earned by a person working for a given amount of time. Likewise, the rate of a chemical reaction is a measure of how much reactant is consumed, or how much product is produced, by the reaction in a given amount of time.
The rate of reaction is the change in the amount of a reactant or product per unit time. Reaction rates are therefore determined by measuring the time dependence of some property that can be related to reactant or product amounts. Rates of reactions that consume or produce gaseous substances, for example, are conveniently determined by measuring changes in volume or pressure. For reactions involving one or more colored substances, rates may be monitored via measurements of light absorption. For reactions involving aqueous electrolytes, rates may be measured via changes in a solution’s conductivity.
For reactants and products in solution, their relative amounts (concentrations) are conveniently used for purposes of expressing reaction rates. For example, the concentration of hydrogen peroxide, H₂O₂, in an aqueous solution changes slowly over time as it decomposes according to the equation:
The rate at which the hydrogen peroxide decomposes can be expressed in terms of the rate of change of its concentration, as shown here:
This mathematical representation of the change in species concentration over time is the rate expression for the reaction. The brackets indicate molar concentrations, and the symbol delta (Δ) indicates “change in.” Thus, represents the molar concentration of hydrogen peroxide at some time t₁; likewise, represents the molar concentration of hydrogen peroxide at a later time ₂; and Δ[H₂O₂] represents the change in molar concentration of hydrogen peroxide during the time interval Δ (that is, ₂ − ₁). Since the reactant concentration decreases as the reaction proceeds, Δ[H₂O₂] is a negative quantity. Reaction rates are, by convention, positive quantities, and so this negative change in concentration is multiplied by −1. Figure 12.2 provides an example of data collected during the decomposition of H₂O₂.
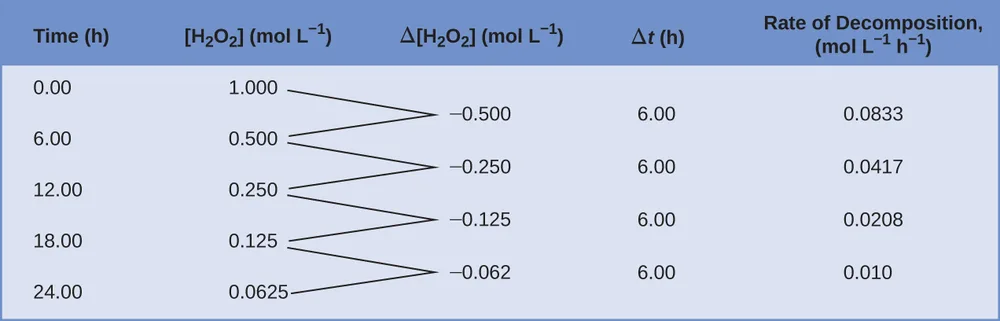
To obtain the tabulated results for this decomposition, the concentration of hydrogen peroxide was measured every 6 hours over the course of a day at a constant temperature of 40 °C. Reaction rates were computed for each time interval by dividing the change in concentration by the corresponding time increment, as shown here for the first 6-hour period:
Notice that the reaction rates vary with time, decreasing as the reaction proceeds. Results for the last 6-hour period yield a reaction rate of:
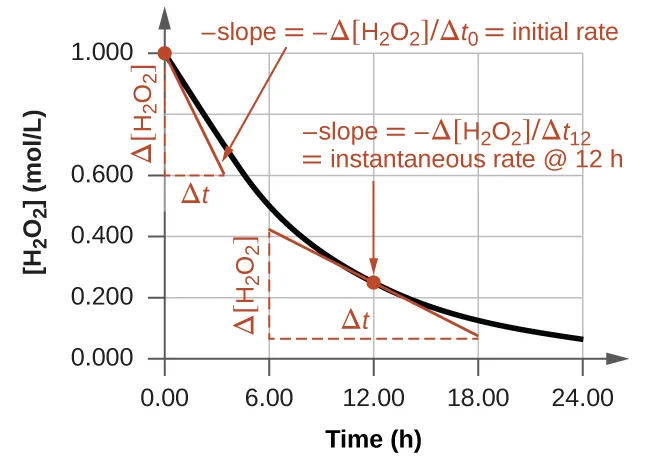
This behavior indicates the reaction continually slows with time. Using the concentrations at the beginning and end of a time period over which the reaction rate is changing results in the calculation of an average rate for the reaction over this time interval. At any specific time, the rate at which a reaction is proceeding is known as its instantaneous rate. The instantaneous rate of a reaction at “time zero,” when the reaction commences, is its initial rate. Consider the analogy of a car slowing down as it approaches a stop sign. The vehicle’s initial rate—analogous to the beginning of a chemical reaction—would be the speedometer reading at the moment the driver begins pressing the brakes (t₀). A few moments later, the instantaneous rate at a specific moment—call it t₁—would be somewhat slower, as indicated by the speedometer reading at that point in time. As time passes, the instantaneous rate will continue to fall until it reaches zero, when the car (or reaction) stops. Unlike instantaneous speed, the car’s average speed is not indicated by the speedometer; but it can be calculated as the ratio of the distance traveled to the time required to bring the vehicle to a complete stop (Δt). Like the decelerating car, the average rate of a chemical reaction will fall somewhere between its initial and final rates.
The instantaneous rate of a reaction may be determined one of two ways. If experimental conditions permit the measurement of concentration changes over very short time intervals, then average rates computed as described earlier provide reasonably good approximations of instantaneous rates. Alternatively, a graphical procedure may be used that, in effect, yields the results that would be obtained if short time interval measurements were possible. In a plot of the concentration of hydrogen peroxide against time, the instantaneous rate of decomposition of H₂O₂ at any time t is given by the slope of a straight line that is tangent to the curve at that time (Figure 12.3). These tangent line slopes may be evaluated using calculus, but the procedure for doing so is beyond the scope of this chapter.
Relative Rates of Reaction
The rate of a reaction may be expressed as the change in concentration of any reactant or product. For any given reaction, these rate expressions are all related simply to one another according to the reaction stoichiometry. The rate of the general reaction
can be expressed in terms of the decrease in the concentration of A or the increase in the concentration of B. These two rate expressions are related by the stoichiometry of the reaction:
Consider the reaction represented by the following equation:
The relation between the reaction rates expressed in terms of nitrogen production and ammonia consumption, for example, is:
This may be represented in an abbreviated format by omitting the units of the stoichiometric factor:
Note that a negative sign has been included as a factor to account for the opposite signs of the two amount changes (the reactant amount is decreasing while the product amount is increasing). For homogeneous reactions, both the reactants and products are present in the same solution and thus occupy the same volume, so the molar amounts may be replaced with molar concentrations:
Similarly, the rate of formation of H₂ is three times the rate of formation of N₂ because three moles of H₂ are produced for each mole of N₂ produced.
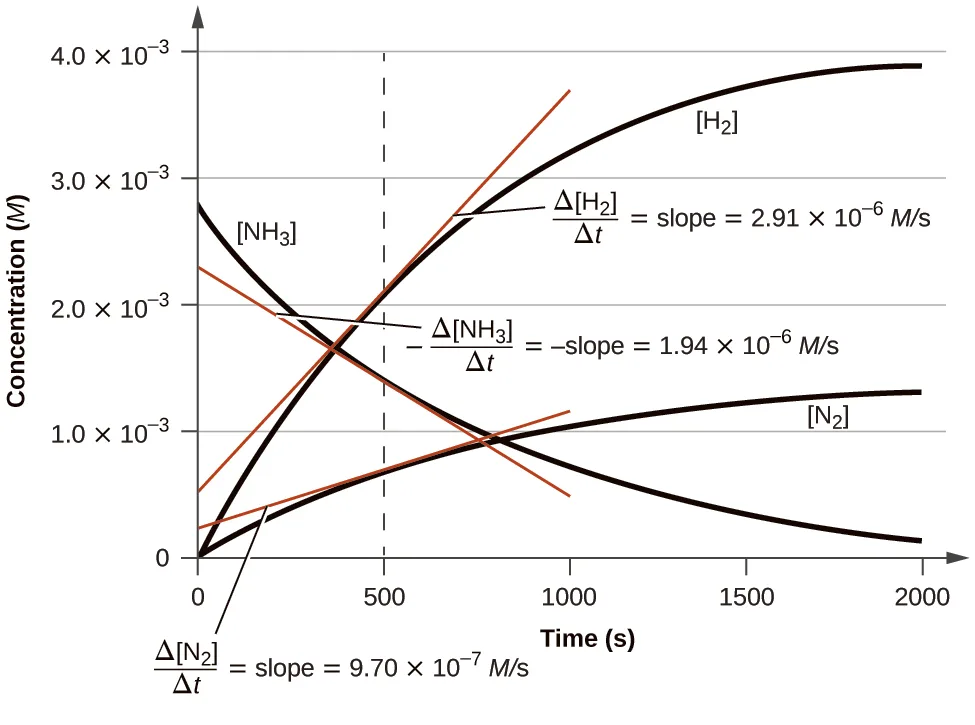
Figure 12.5 illustrates the change in concentrations over time for the decomposition of ammonia into nitrogen and hydrogen at 1100 °C. Slopes of the tangent lines at t = 500 s show that the instantaneous rates derived from all three species involved in the reaction are related by their stoichiometric factors. The rate of hydrogen production, for example, is observed to be three times greater than that for nitrogen production:
Key Concepts and Summary
The rate of a reaction can be expressed either in terms of the decrease in the amount of a reactant or the increase in the amount of a product per unit time. Relations between different rate expressions for a given reaction are derived directly from the stoichiometric coefficients of the equation representing the reaction.